Harvard CS171 - Visualization by Hanspeter Pfister
Lec.1 Introduction
What is visualization?
To convey information through graphical representations of data
Visualization goals:
- Record information
- Analyze data to support reasoning
- Develop and assess hypotheses(visual exploration)
- Find patterns and discover errors data
- Communicate information to others
- Share and persuade(visual explanation)
Lec.2 Design Principles
Clutter and confusion are not attributes of information, they are failures of design - E.Tufte
Tufte’s Integrity Principles:
- Show data variation, not design variation
- Clear, detailed, and through labeling and approriate scales
- Size of the graphcis effect should be directly proportinal to the numerical quantities
Tufte’s Design Principles:
- Maximize data-ink ratio
- Avoid chart junk
- Increase data density
- Layering of information
Lec.3 Data Models & Visual Variables
Data Types:
- Nominal(Categorical)
- Are = or $\neq$ to other values
- Ordinal
- Obey a < relationship
- Quantitative
- Can do arithmetic on them
- Interval (no “true zero”): dates, location. Cannot compare directly. Only differences can be compared.
- Ratio (zero fixed): Origin is meaningful, can measure ratios & proportions.
Data vs. Conceptual Model:
- Data Model: Low-level description of the data(1D floats, 3D vector of floats)
- Conceptual Model: Mental construction(temperature, space)
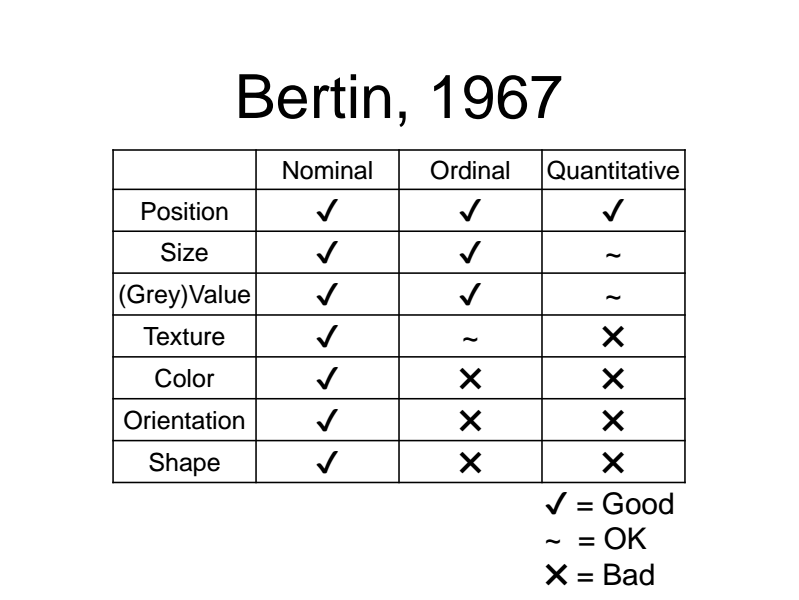
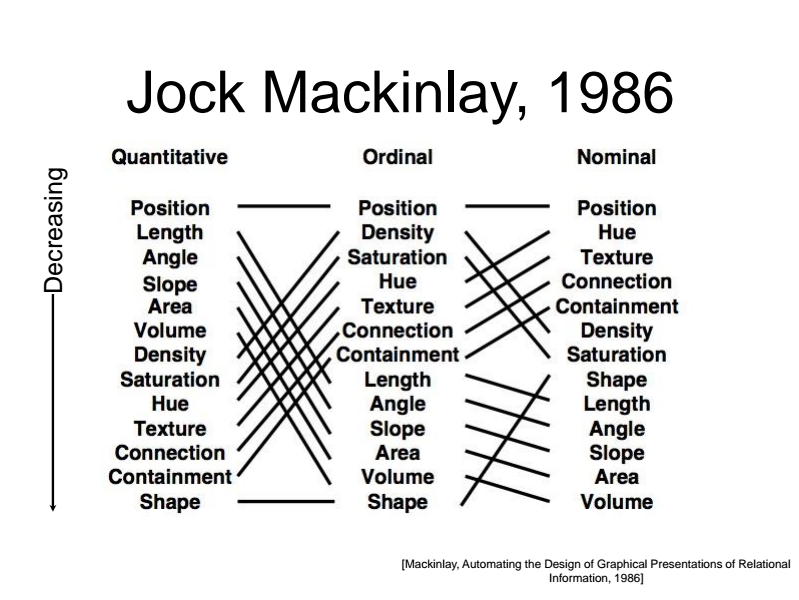
Bertin’s Visual Variables:
Objectives: Points, Lines, Areas
Channels: Position, Size, (Grey)Value, Texture, Color, Orientation, Shape
- Points: Strongest visual variable; Suitable for all data types
- Sometimes not available
- Cluttering
- Size & Length: Good visual variable; Easy to see whether one is bigger; Grouping works
- Good for aligned bars
- OK for changes in length
- Bad for changes in area
- Shape: Great to recognize many classes
- No grouping, ordering
- Value: Good for quantitative data when length & size are used; Supports grouping; Is preattentive if sufficiently different
- Not very many shades recognizable
- Color: Good for qualitative data; Is preattentive if sufficiently different
- Limited number of classes
- Not good for quantitative data
- Lots of pitfalls! Be careful!
Characteristics of Visual Variables:
- Selective: Is a mark distinct from other marks?
- Associative: Does it supporting grouping?
- Quantitative: Can we quantify the difference between two marks?
- Order: Can we see a change in order?
- Length: How many unique marks can we make?
Graphical Perception:
Lec.4 Interaction
The Shneiderman Mantra: Overview first, zoom and filter, and details on demand.
- Focus + Context
- Brushing & Linking
- Filtering
- Zooming
- Animation
Lec.5 Networks & Trees
TBD
Lec.6 Data Visualization Process & Graphs
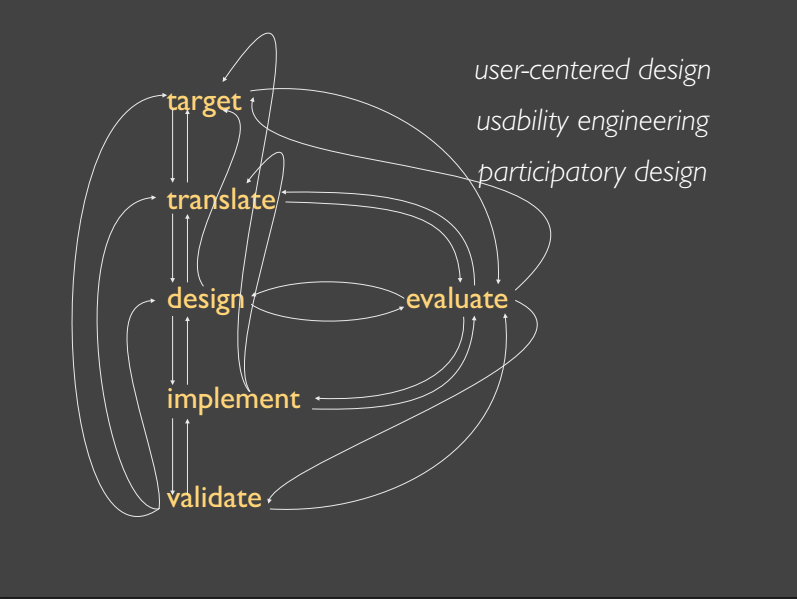
- Target
- Choose a specific domain
- Define research question(s)
- Find & clean the data
- Translate (What? 80%)
- Formulate data analysis tasks
- Exploratory data analysis
- Transform & summarize data
- Design (How? 20%)
- Design visual encodings
- Design interactions
- Sketch many ideas!
- Implement
- Use code “sketches”
- Define data structures
- Find efficient algorithms
- Validate
- Is the visualization effective?
- Does it support the tasks?
- Does it provide new insights?
Comparisions: Bar Chart, Waterfall Chart, Dot Plots
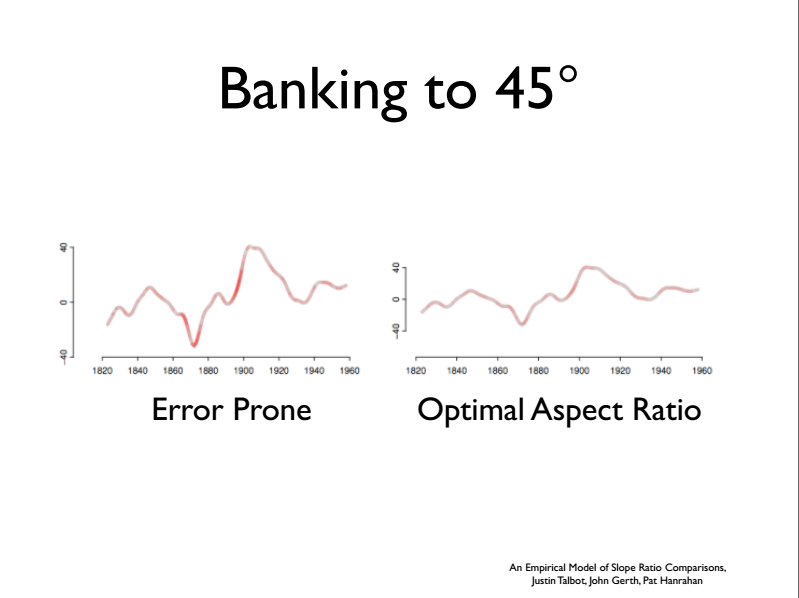
Bar Chart vs. Line Chart: Line implies trend. Do not use for categorical data.
Two line segments are maximally discriminable when their average absolute angle is $45^\circ$.
Trends Over Time: Line Chart, Streamgraphs
Proportions: Pie Chart, Donut CHart, Stacked Bar Chart, Small Multiples, Stacked Area Chart
Distribution: Histogram, Density Plots, Box & Whisker Plots
Correlations: Scatterplots, Trend Lines, Residual Graph, Quadrants, Path Plots
Visualization Taxonomy: What Makes a Visualization Memorable?
Lec.7 High-Dimensional Data

- How many dimensions?
- ~50: tractable with “just” vis
- ~1000 - need analytical methods
- How many records?
- ~1000 - “just” vis is fine
- >10,000 - need analytical methods
- Homogeneity?
- Same data type?
- Same scales?
Geometric Methods
- Parallel Coordinates: Shows primarily relationships between adjacent axis
- Each axis represents dimension
- Lines connecting axis represent records
- Suitable for all tabular data typesa (Also heterogeneous data)
- Limited scalability (~50 dimensions, ~1-5k records)
- Interaction is crucial: Axis reordering, Brushing, Filtering
- Star Plot: Similar to parallel coordinates, radiate from a common origin
- Small Multiples: Use multiple views to show different partitions of a dataset
- Scatterplot Matrices(SPLOM): Matrix of size d*d, each cell plots a scatterplot of two dimensions
- Limited scalability (~20 dimensions, ~500-1k records)
- Brushing is important
- Often combined with “Focus Scatterplot” as F+C technique
- Others: Connected Charts, Domino, etc.
Pixel Based Methods
- Each cell is a “pixel”, value encoded in color/value
- Meaning derived from ordering
- If no ordering inherent, clustering is used
- Good for homogeneous dataset
- Color is relative!(Also should consider the blindness)
Dimensionality Reduction
- Principal Component Analysis(PCA)
- Linear mapping, by order of variance
- Multidimensional Scaling(MDS)
- Nonlinear, better suited for some dataset
- Popular for text analysis
Can we trust dimensionality reduction?: Interpretation and Trust: Designing Model-Driven Visualizations for Text Analysis
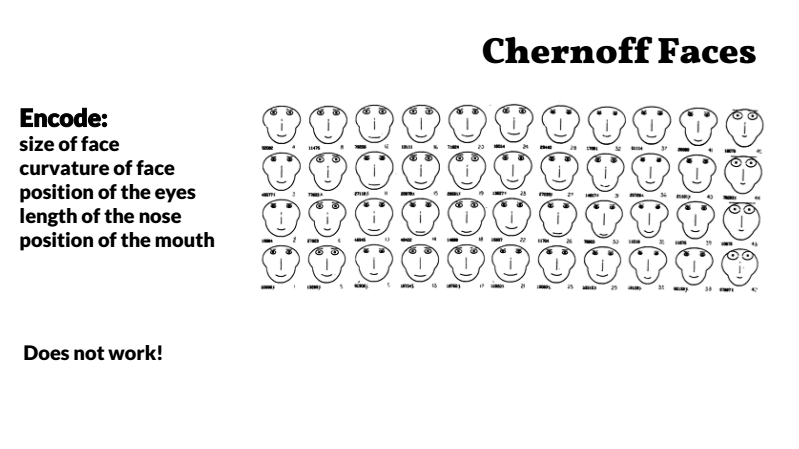
Glyph
Lec.8 Text and Document Visualization
Features of Text:
- Abstract
- General for mental concepts
- Different across population groups
- Linear perception
- Semi-structured
- Legibility!
Vis for Text Collections:
Vis for Large Document Collections:
Others:
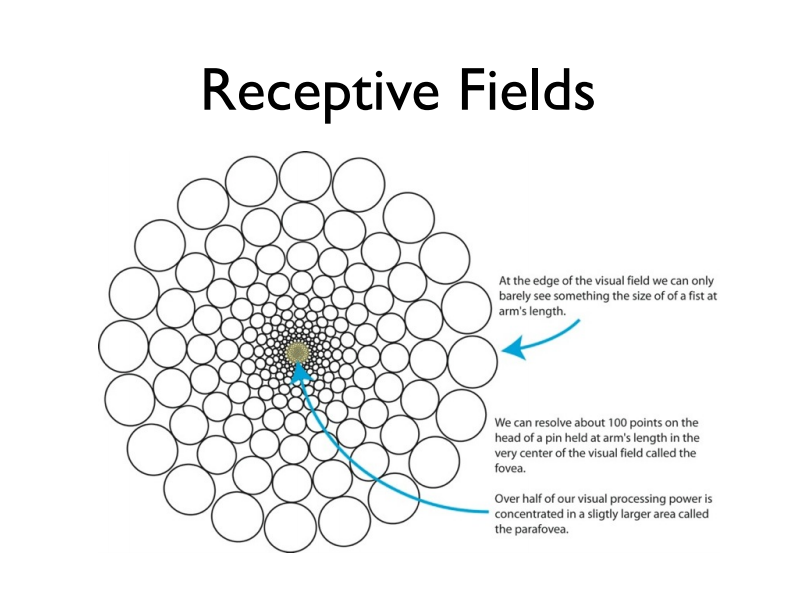
Lec.9 Perception
Hallucination:
Tips:
- We are scanning visualizations in reading order and are attracted to titles, text, and labels. Put titles at the top left and put labels and textual explanations close to the visualization.
- Our visual system sees differences, not absolute values, and is attracted to high-contrast edges. Maximize contrast between visual elements to make them stand out and avoid busy textures.
- Draw the user’s eye to the most important part of the visualization. Provide a visual hierarchy of imnformation that will help make it clear to the user how they should interact with the information.
- We can easily see objects that are different color or that are in motion. Use color and motion sparingly to make the important information pop out.
- The brain is organized hierarchically, with higher brain regions processing more abstract features. User-recognizable objects in a visualization will be processed differently than low-level features.
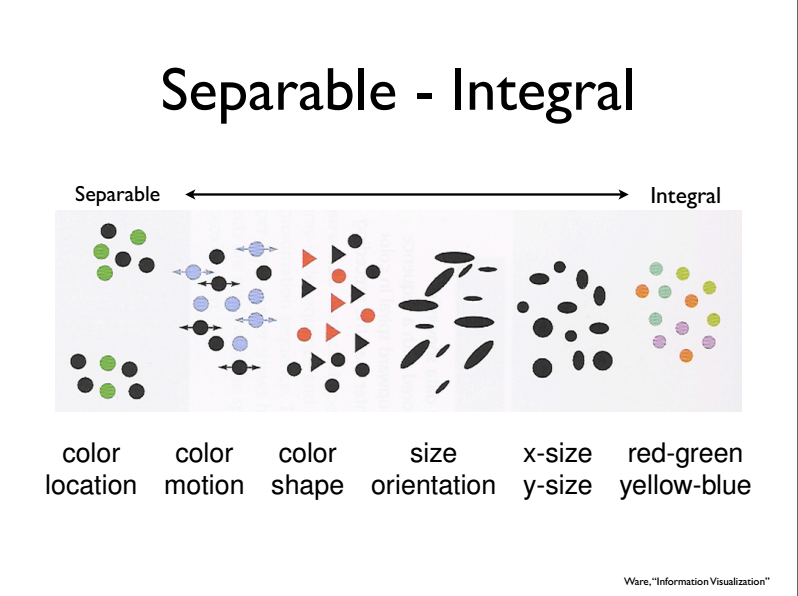
- Some channels are integral and cannot be separated without a lot of cognitive effort. Be careful whenever you use multiple channels to encode information.
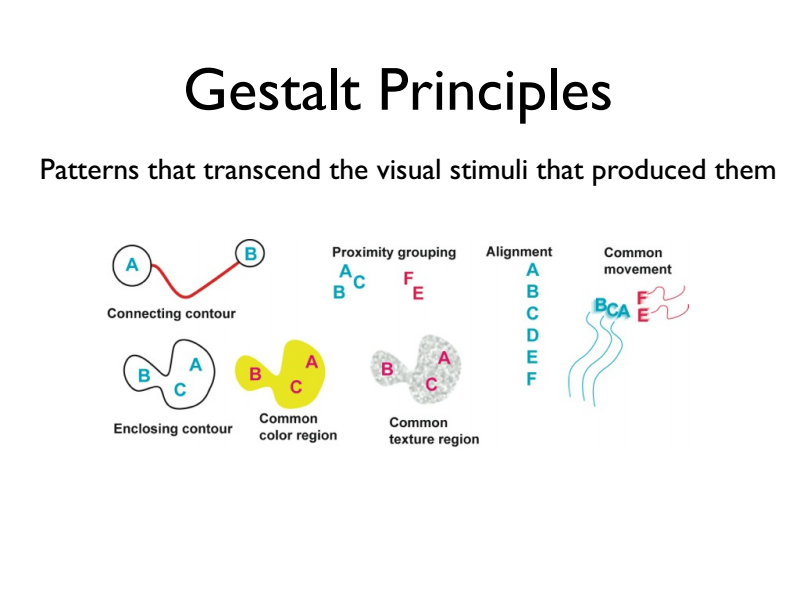
Gestalt Principles
Proximity, Similarity, Connection, Enclosure, Grouping, Continuity, Closure, Symmetry, Figure/Ground, Common Fate.
Lec.10 Color
“… avoiding catastrophe becomes the first principle in bringing color to information: Above all, do no harm.” –E.R. Tufte
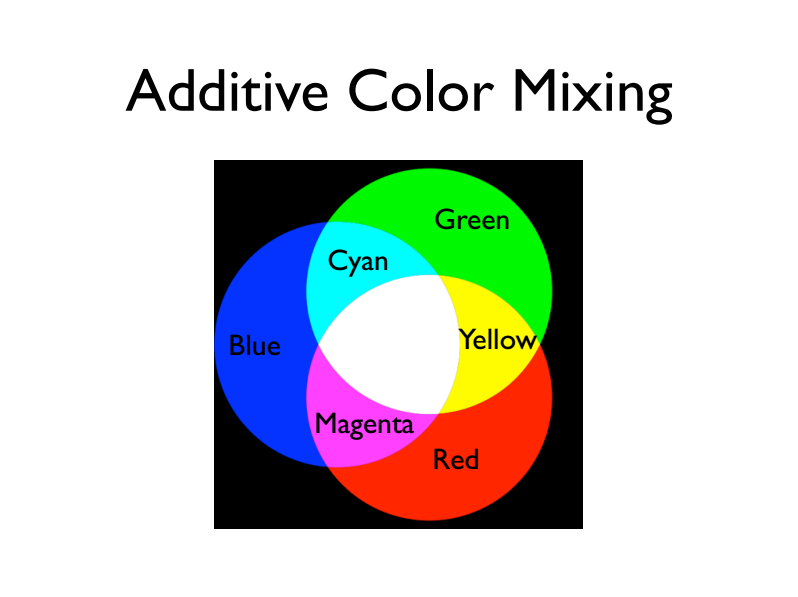
Additive Color Mixing: When colors combine by adding their spectra
- Monitors, Projectors, Slide Film, etc.
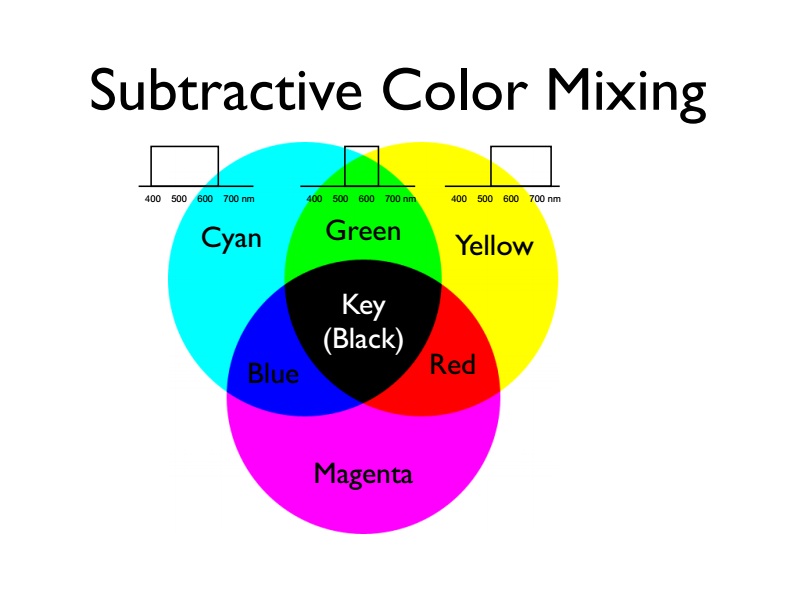
Subtractive Color Mixing: When colors combine by multiplying their spectra
- Light reflecting off a surface, optical filters, crayons, etc.
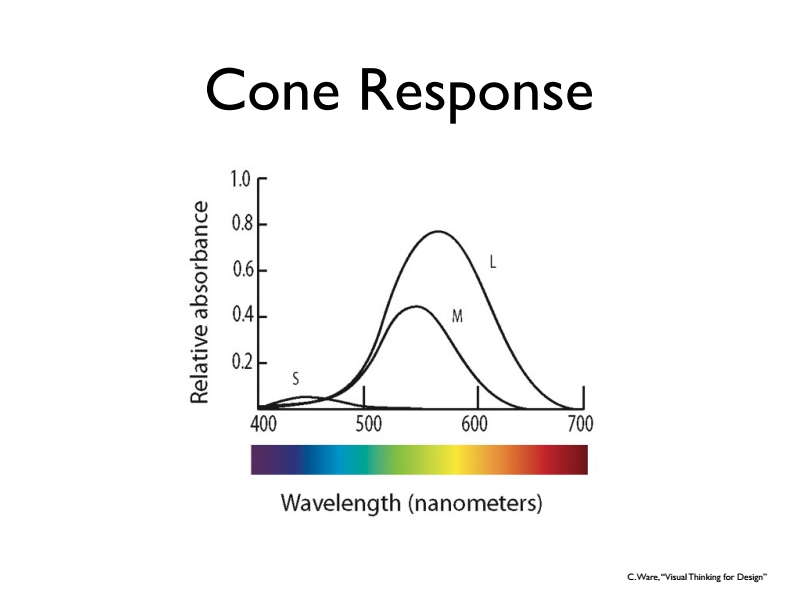
Visual Cones:
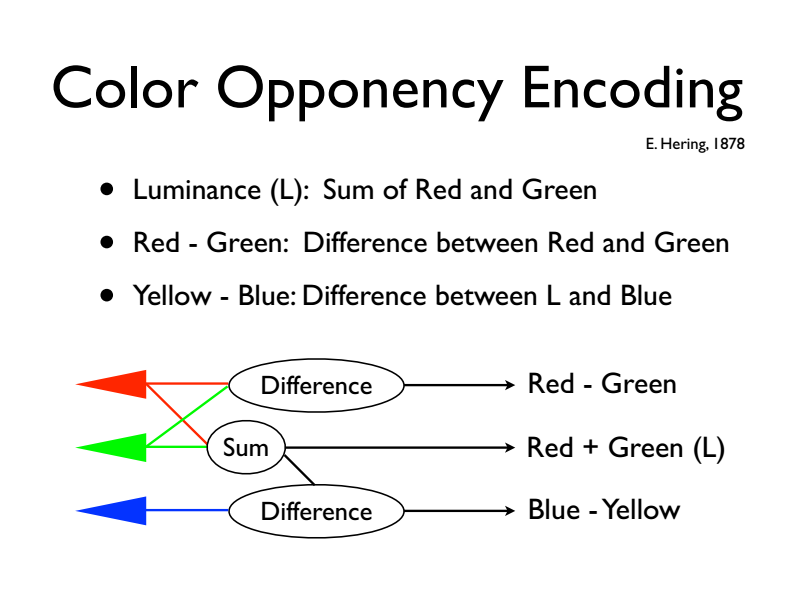
Color Perception:
Higher contrast sensitivity in luminance than in chrominance.
A Color-Caused Optical Illusion on a Statistical Graph
Color Blindness: - Red / Green deficiencies: No L cones or No M cones - Blue /Yellow deficiencies: No S cones
About 7-10% of the male population is red-green colorblind. Make sure that colors are not your only method of conveying important information.
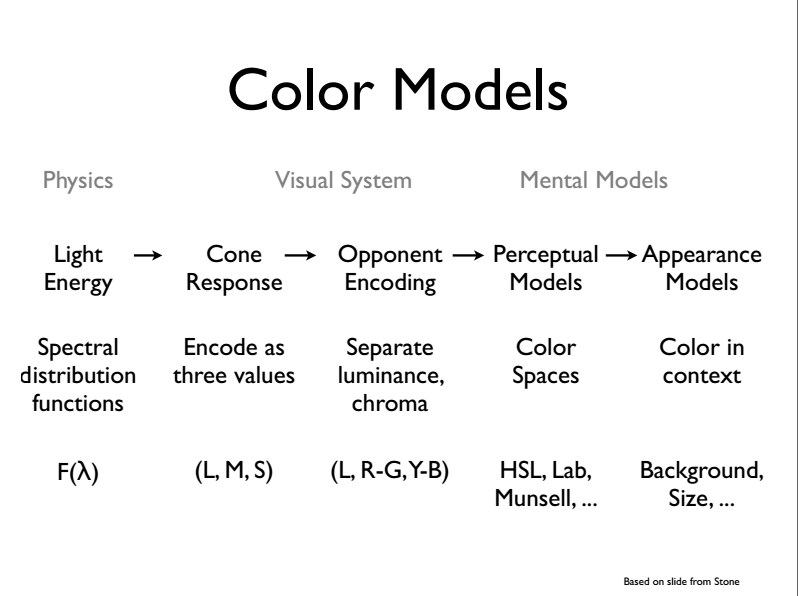
Color Space:
- RGB Color Space:
- Additive system
- Colors that can be represented by computer monitors
- Not perceptually uniform
- HSL Color Space
- Hue - what people think of color
- Saturation - distance from grey
- Luminance - from dark to light
- Not perceptually uniform - brightness of hues seems to vary
- LAB / HCL Color Spaces
- Perceptually uniform!
- L - Luminance
- AB - approximate R/G and Y/B opponent channels
- HCL: Hue-Chroma-Lightness: Cylindrical transformation of LAB
- Munsell Color Space
- Perceptually uniform version of HSL
- Surface colors, not emitted light
- Used for paint swatches
Colors for Nominal Data:
- Ware suggests:
- red, green, yellow, blue, black, white
- pink, cyan, grey, orange, brown, purple
Nominal colors, sequential colors, diverging colors.
Lect.11 Cognition
Perception vs. Cognition:
- Perception: About the nature of the signals coming in; What you see
- Cognition: About how you understand and interpret what you see
Vision is “Constructed” top down from the input.
“What you see when you see a thing depends on what the thing is. What you see the thing as depends on what you know about what you are seeing.”
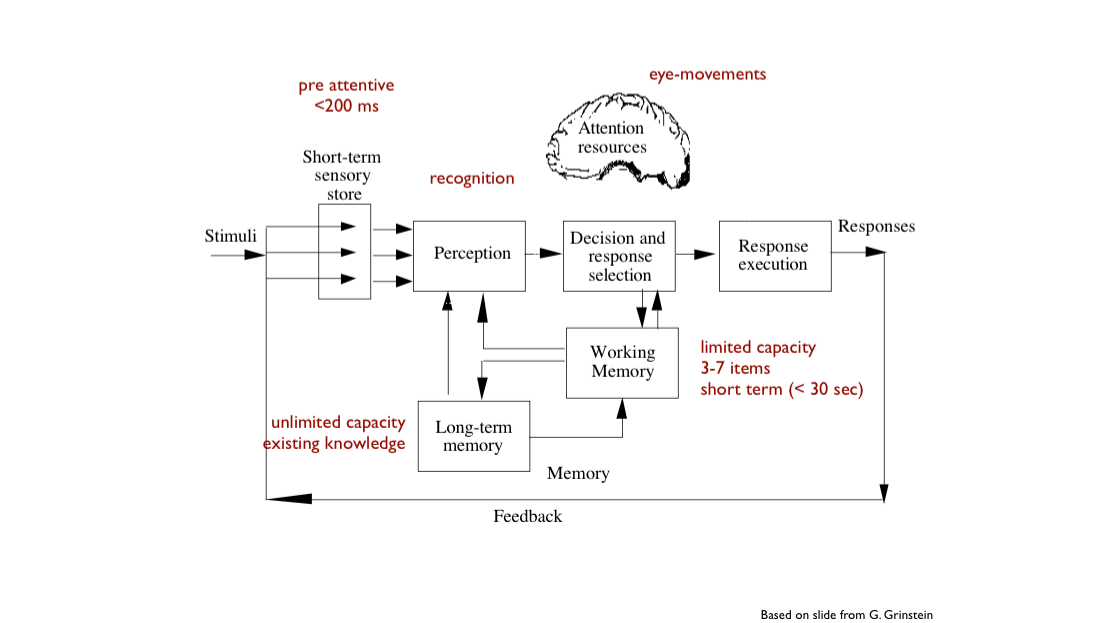
Image Gist
- From one glance to the next, the most of the visual information is a summary of what’s there, which lacks local detail.
- The gist refers to the visual information perceived after/during a glance at an image
- In a glance(~100ms), we remember the meaning of an image and its global layout
- Some objects and details are forgotten
Tips:
- Image gist gives you layout
- Can give you general categorization info but lacks detail
- Atten is required to get specific details
Visual Attention
- Attentiion is Selective
- Attentional blindness
- Attention to one aspect or feature of the input suppresses processing of other features
- Where people look depends on knowledge
- People learn something more easily if they can relate it to something they already know
Tips:
- To find meaning in what we see we must selectively pay attention to what is important
- Low-level vision is driven by object features rather than a conscious effort where to look(e.g., pre-attentive processing)
- Attention is driven by preexisting knowledge, expectations, and goals stored in long-term memory
Visual Working Memory
Georage Miller’s 7$\pm$2 rule; Cowen: 3-4 visual objects
The number of items that can be held in VSTM depends on their complexity.
Visual Long Term Memory
What we know: People can remember thousands of scenes.
What we don’t know: What people are remembering for each item?
- “Gist” Only? Sparse detail? Highly Detailed?
Hypothesises:
- People only remember the gist
- Exemplars of the same category will interfere
- Efficient recognition; no interferenec
- Representation of each image has a unique code that distinguishes itself from all the other images
What Makes a Visualization Memorable?
- It contains human distinguishable objects
- It is a distinct visualization type
- It is colorful
- It is visually dense
- It has a low data-to-ink ratio
Conclusion
- Gist
- Spatial layout
- Basic level category
- Experience of rich percept
- No local details
- Attention & eye movements
- Where you look depends on: salience, task-demands, prior knowledge
- Attending to specific areas fills in local details
- Working memory
- Limited capacity
- Amount of information depends on experience and complexity
- Eye movements are cheap; memory is expensive
- Long-term memory
- Massive capcacity
- Can be surprisingly detailed!
- Aggregate visual experience
- Provide ‘chunks’ for working memory and ‘guidance’ for attention
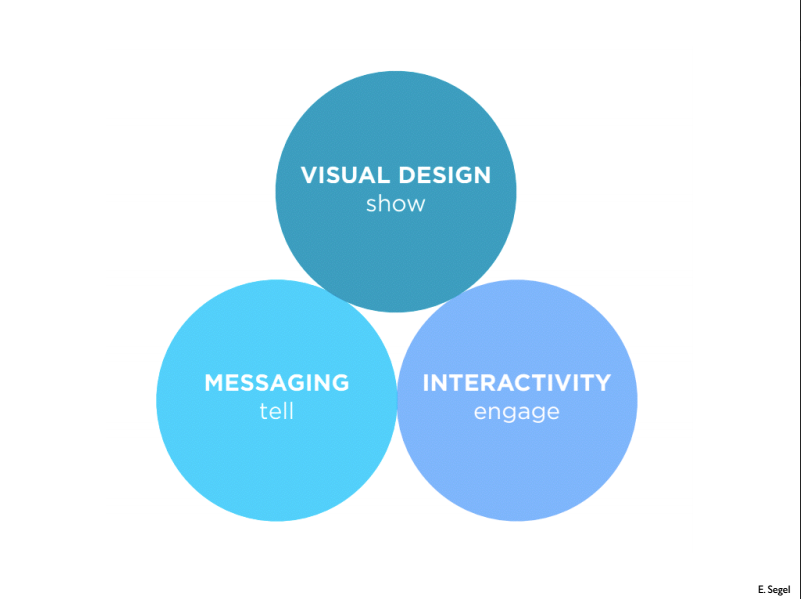
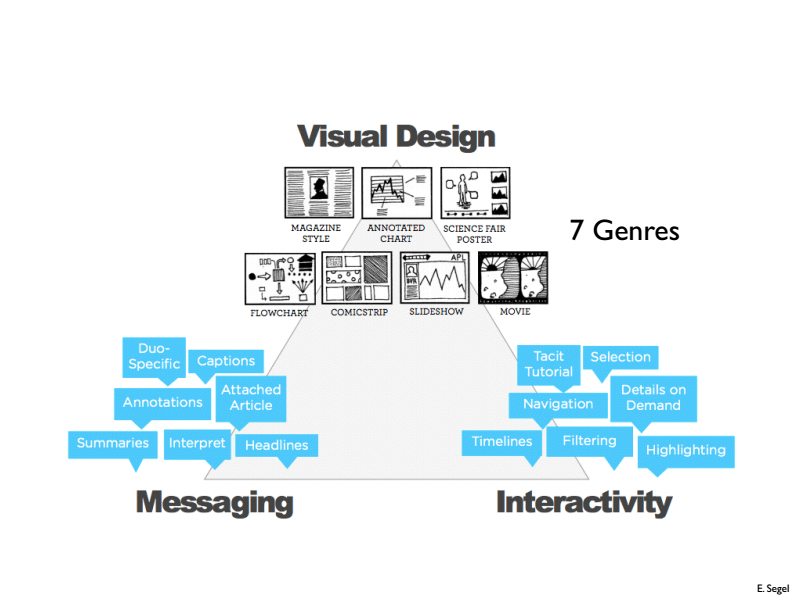
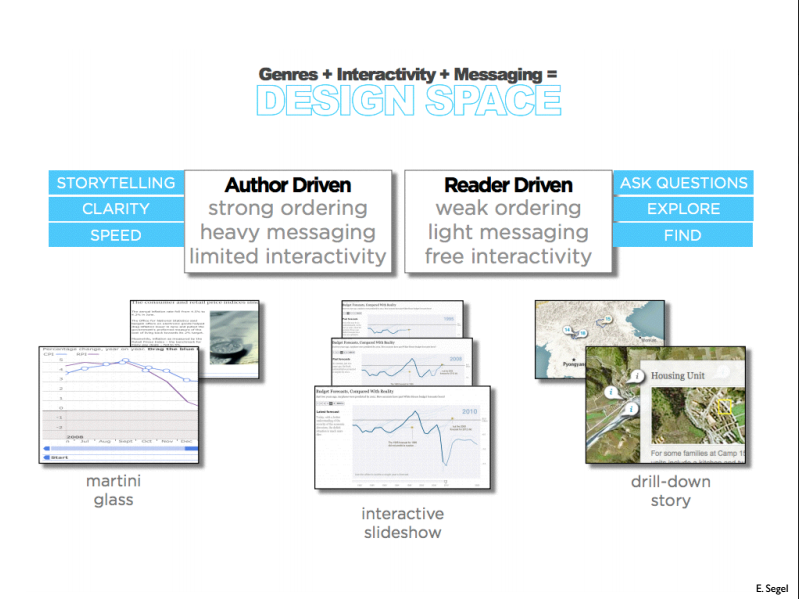
Lec.12 Storytelling